Why the Agency Lost Trust in Weekly Performance Reviews
Two hours before a Thursday client review, the team at Northstar Growth was still cleaning spreadsheets.
One buyer exported spend data from Meta Ads Manager. Another matched campaign names against an Airtable tracker. A strategist noticed CTR was falling, but nobody could explain whether the issue came from creative fatigue, audience saturation, or a delayed launch.
The agency managed 12 client accounts across ecommerce, SaaS, and lead generation. Reporting was supposed to create clarity. Instead, it created delay.
The team realized they did not need another visualization layer. They needed a Facebook ads reporting dashboard that connected performance metrics to the operational workflow creating those results.
The problem became more important as creative volume increased. According to Nielsen Catalina Solutions research commissioned by Meta, creative quality drives 56% of sales lift from digital advertising campaigns. Source: Nielsen Catalina Solutions and Meta research.
Northstar reviewed tools such as Sotrender, Revealbot, and Hootsuite Ads. Those tools helped automate reporting, but the agency's larger challenge was operational visibility.
That realization aligned with ideas discussed in Why Most Facebook Ad Management Platforms Are Doing It Wrong (And What You Should Do Instead), where workflow integration matters more than isolated reporting screens.
The agency also recognized that reporting delays affected client trust. When account managers could not explain sudden CPA changes or pacing spikes during live meetings, clients started questioning strategic decisions.
Weekly reporting cycles created blind spots:
- Creative fatigue appeared too late
- Budget pacing drifted for days
- Attribution disagreements slowed optimization
- Launch delays stayed hidden
- Naming inconsistencies broke segmentation
- Teams spent more time reconciling data than analyzing it
Northstar decided to redesign reporting around operational speed instead of static dashboards.
The Hidden Cost of Spreadsheet-Based Facebook Ads Reporting

Northstar mapped the downstream effects of reporting delays.
Every reporting gap created another operational problem:
- Creative fatigue was discovered late
- Campaign naming inconsistencies broke analysis
- Spend pacing drifted from plan
- Launch histories became difficult to audit
- Attribution conversations consumed more meeting time
- Budget changes happened without operational context
Before the rebuild, reporting happened weekly. By the time a trend appeared in a spreadsheet, performance often had already shifted for several days.
The agency documented measurable workflow improvements after implementing a centralized Facebook ads reporting dashboard:
| Metric | Before | After |
|---|---|---|
| Reporting cadence | Weekly | Daily |
| Pacing issue detection | 4 days | Same day |
| Creative replacement turnaround | 5 days | 36 hours |
| Manual reporting time | 11 hours/week/account | 3 hours/week/account |
The numbers mattered, but the mindset shift mattered more.
Reporting stopped being a retrospective activity. It became part of daily operations.
The dashboard tracked creative launches, pacing, testing velocity, production delays, and campaign performance together.
Northstar also borrowed workflow concepts from Breaking the Creative Bottleneck: How One Growth Team Scaled Facebook Ads Throughput with AI and Why Meta Ads Reporting Breaks Once Creative Testing Scales.
The agency discovered that the real bottleneck was not a lack of metrics. It was fragmentation.
Facebook ads data lived in multiple systems:
- Meta Ads Manager
- Creative review boards
- Slack launch approvals
- Google Sheets pacing trackers
- Airtable asset libraries
- Client reporting decks
Because the systems were disconnected, teams interpreted the same performance issue differently.
A buyer blamed audience overlap. A strategist blamed offer fatigue. A designer blamed weak landing pages.
Without centralized operational reporting, diagnosis became subjective.
What Metrics Should a Facebook Ads Reporting Dashboard Track Daily?
After several iterations, Northstar standardized monitoring around a smaller set of operational KPIs.
The dashboard prioritized:
- Spend pacing by objective
- CTR trends by creative type
- Frequency changes across audiences
- CPA volatility by launch cohort
- Creative replacement velocity
- Landing page engagement
- Attribution gaps
- Creative fatigue indicators
- Budget allocation shifts
- Launch timing delays
The team learned that context mattered more than isolated metrics.
A declining CTR meant something different when:
- No new creative had launched recently
- Frequency was rising rapidly
- Landing page engagement also dropped
- Audience overlap increased after duplication
- Budget pacing accelerated unexpectedly
Instead of asking which campaigns were down, the team asked which workflow failure created the decline.
Northstar later expanded attribution analysis using concepts from Diagnosing Attribution Challenges in Facebook Ads and How to Fix Them.
The team also created threshold alerts inside Instrumnt. If pacing exceeded predefined tolerances or audience frequency crossed fatigue thresholds, account managers received notifications before weekly reviews.
This shifted optimization from reactive reporting to proactive intervention.
According to HubSpot's State of Marketing report, 64% of marketers now use AI in their marketing workflows. Source: HubSpot State of Marketing report.
Northstar believed that AI-assisted reporting only became valuable once the underlying data structure became consistent.
Mini Scenario: The KPI Shift That Prevented an Incorrect Budget Cut
One furniture client nearly reduced spend because blended ROAS stayed below target for six days.
Under the old reporting process, the agency would have cut budgets immediately.
The new dashboard exposed additional context:
- Creative launch timestamps
- Frequency trends
- Landing page engagement data
- First-click CTR performance
- Launch velocity metrics
- Creative approval delays
The analysis showed that acquisition quality remained healthy.
The actual issue was operational. Three top-performing creatives reached frequency limits at roughly the same time while replacement assets were delayed.
Prospecting CTR stayed above baseline. Creative supply had become the bottleneck.
The team maintained budget levels, accelerated deployment of new assets, and performance recovered within a week.
This scenario reinforced a simple lesson: dashboards become more valuable when they explain causes rather than simply displaying outcomes.
The approach mirrored concepts from Automated Facebook Ads Learning Loops with Instrumnt and Claude Code.
The agency later added launch velocity scoring to its Facebook ads reporting dashboard. Campaigns with slowing creative replacement cycles received operational risk flags even before performance deteriorated.
That prevented additional pacing mistakes across multiple client accounts.
Designing a Facebook Ads Reporting Dashboard Around Creative Decisions
Most Facebook ads dashboards focus on metrics such as:
- ROAS
- CPA
- CPC
- CTR
- CPM
Northstar redesigned reporting around creative decisions instead.
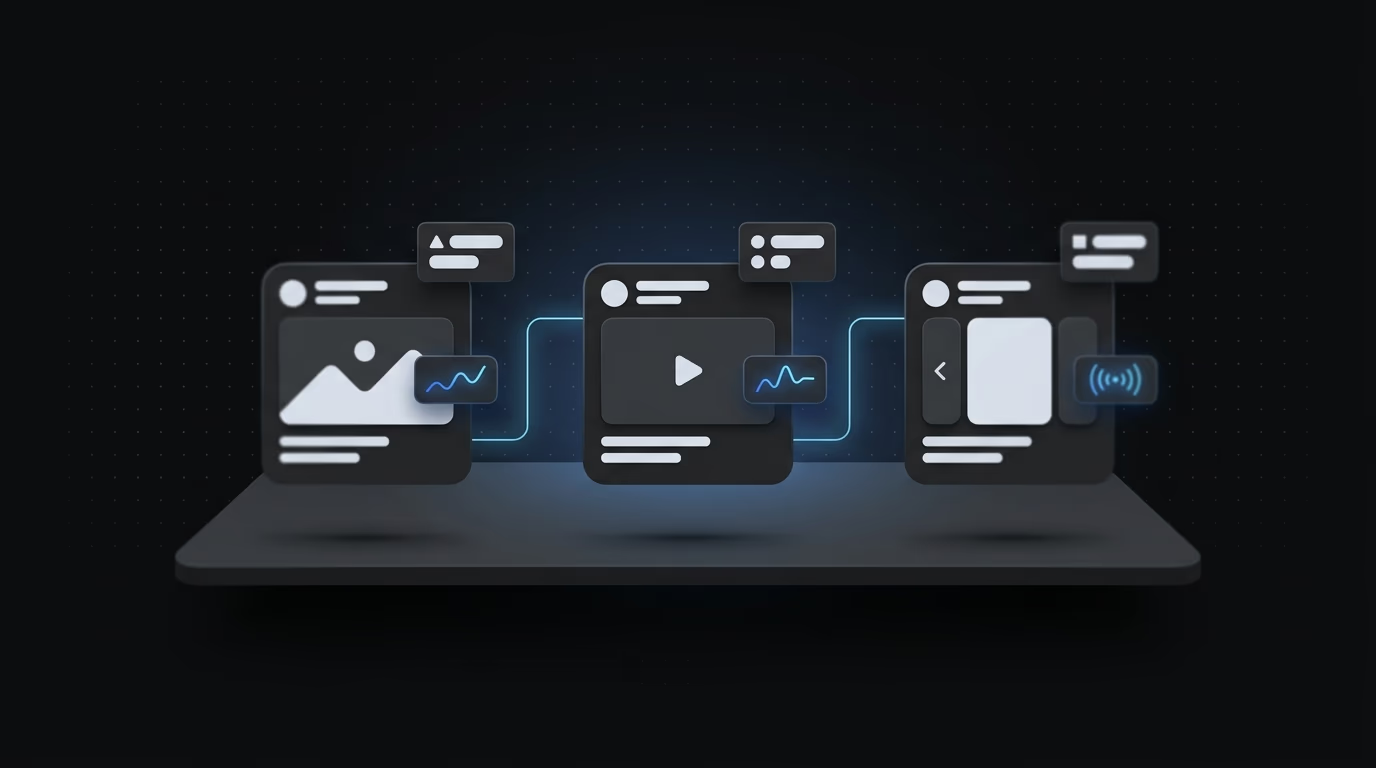
Every ad launched with metadata attached:
- Hook category
- Offer angle
- Creator type
- Format ratio
- Landing page version
- Audience intent category
- Upload batch ID
- Funnel stage
The metadata synced into Instrumnt during campaign setup.
Within weeks, the agency identified patterns that previously remained hidden.
Founder-led testimonial videos often maintained CTR stability longer than polished motion graphics. Prospecting campaigns launched with multiple active creative variants generally experienced lower CPA volatility.
The dashboard stopped functioning as a passive reporting tool. It became a production planning system.
Northstar also introduced fatigue alerts based on internal thresholds. When audience frequency crossed predefined levels, the account was flagged automatically.
The team supplemented this process with ideas from Automate Creative Testing for Meta Ads and CBO vs ABO: Why Most Campaign Structures Are Broken.
Creative metadata became one of the most valuable layers inside the reporting system.
Instead of reviewing campaigns as isolated ad sets, teams could analyze performance patterns across:
- Creative styles
- Offer categories
- Video formats
- Creator personas
- Funnel stages
- Product positioning
That allowed Northstar to identify repeatable creative behaviors across multiple accounts instead of relying on anecdotal observations.
Uploader Workflow: Syncing Bulk Meta Ad Launches Into Dashboard Tracking

The biggest operational improvement came from connecting the Facebook ads uploader directly to reporting.
Previously, campaign launches and reporting existed in separate systems.
Media buyers launched campaigns inside Meta Ads Manager and manually updated reporting sheets afterward. Errors accumulated quickly.
The rebuilt workflow centered around structured uploads.
Every asset uploaded through Instrumnt carried:
- Creative tags
- Campaign objectives
- Funnel-stage classifications
- Audience segments
- Creator sources
- Launch dates
- Variant identifiers
- Creative testing labels
The Facebook ads uploader became the bridge between execution and analytics.
When campaigns launched, reporting records were automatically populated with standardized metadata.
This reduced cleanup work dramatically and accelerated diagnosis.
Performance issues could be segmented by:
- Creative format
- Audience overlap
- Timing
- Placement mix
- Offer angle
- Landing page alignment
Northstar also adopted workflow principles from Meta Ads Bulk Upload Workflow: A Step-by-Step Operations Guide and How to Scale Meta Ads with Bulk Uploading.
The agency additionally implemented upload validation rules.
Campaigns could not launch unless:
- Naming conventions matched standards
- Creative metadata was complete
- Audience tags were assigned
- Funnel stages were selected
- Approval workflows were finalized
This prevented reporting corruption before campaigns even went live.
Over time, the Facebook ads uploader became a quality-control system as much as a deployment system.
How Agencies Automate Facebook Ads Reporting Without Spreadsheets
Northstar eventually separated reporting into four layers:
- Data collection
- Metadata synchronization
- Automated diagnostics
- Human decision-making
The dashboard automatically collected:
- Spend data
- Conversion data
- Creative metadata
- Pacing metrics
- Launch history
- Landing page engagement indicators
- Audience frequency changes
The agency still used categories of tools represented by Sotrender, Revealbot, and Hootsuite Ads for selected automation tasks. However, the primary objective shifted from visualization to operational visibility.
Consistency became critical. Naming conventions and metadata structures had to remain standardized across campaigns.
Without clean metadata, even advanced automation systems become unreliable.
The agency also standardized:
- Campaign naming conventions
- Creative approval workflows
- Launch tagging systems
- Audience labeling rules
- Budget pacing alerts
These operational standards allowed the Facebook ads reporting dashboard to function as a daily command center instead of a passive analytics archive.
Northstar also integrated operational reviews into daily standups.
Instead of discussing only performance metrics, teams reviewed:
- Pending creative approvals
- Delayed launches
- Audience saturation risks
- Budget pacing anomalies
- Landing page issues
- Testing throughput
This operational context dramatically improved decision quality.
The reporting system no longer answered only what happened. It helped explain why performance changed.
Using Claude Code and AI Summaries to Turn Reporting Into Daily Optimization
Northstar's final improvement involved AI-assisted analysis.
Instead of hiring additional analysts to write repetitive updates, the agency exported dashboard data into Claude Code workflows.
The system generated summaries covering:
- Pacing anomalies
- CTR deterioration patterns
- Creative-category performance
- CPA spikes
- Launch cohort comparisons
- Budget allocation changes
The goal was not replacing media buyers.
The goal was reducing reporting lag.
With more than 1,400 active ads running across accounts, manual review alone could not keep pace.
Claude Code and AI summaries gave account managers a daily operational briefing before standups.
Human strategists still handled:
- Budget allocation
- Audience strategy
- Creative direction
- Client communication
- Offer positioning
- Testing priorities
The AI layer simply surfaced patterns faster.
Northstar later expanded the workflow using concepts from Scaling Facebook Ad Testing: Why AI Is the Key to Breaking Through Your Creative Bottleneck.
The agency eventually used AI to categorize recurring operational issues automatically.
Examples included:
- Fatigue-driven CTR decline
- Delayed launch recovery patterns
- Offer saturation
- Landing page mismatch
- Audience duplication overlap
- Budget pacing instability
This allowed account managers to prioritize the highest-impact problems earlier in the day.
Can AI Tools Help Analyze Facebook Ads Dashboard Performance Data?
Yes. AI can be highly effective when applied to structured reporting systems.
Common use cases include:
- Pattern detection across large creative libraries
- Anomaly summaries
- Metadata clustering
- Trend prioritization
- Launch cohort analysis
- Automated alerts
- Creative fatigue monitoring
The strongest results occur when AI operates on clean, structured data generated by standardized workflows.
AI systems perform poorly when campaign names are inconsistent, metadata is incomplete, or reporting depends on disconnected spreadsheets.
That is why Northstar focused on operational consistency before layering automation into the reporting stack.
The agency also learned that AI-generated summaries worked best when paired with human operational reviews.
Account managers still validated:
- Strategic recommendations
- Budget changes
- Creative direction
- Audience expansion decisions
- Client communication
AI accelerated pattern recognition, but strategic judgment still came from experienced operators.
What Changed Once Reporting Became Daily Instead of Weekly
Six months after the rebuild, Northstar's meetings looked completely different.
Instead of opening spreadsheets, teams started discussions with pacing alerts, creative fatigue signals, launch velocity metrics, and audience diagnostics.
Client meetings became shorter because fewer surprises accumulated throughout the week.
Media buyers no longer spent mornings cleaning exports from Facebook ads reports. Strategists spent more time diagnosing creative performance and less time reconciling mismatched data.
Most importantly, the Facebook ads reporting dashboard reflected how modern Meta advertising actually operates.
The dashboard was no longer the product.
The real advantage came from shortening the feedback loop between creative production, campaign launches, reporting diagnostics, AI-assisted analysis, and optimization decisions.
That operational visibility became the agency's competitive advantage and transformed reporting from a passive analytics layer into the system the agency operated from.
Northstar eventually realized the dashboard itself was only one piece of a larger operating model.
The true advantage came from connecting:
- Creative production
- Metadata tagging
- Facebook ads uploader workflows
- AI-assisted summaries
- Daily diagnostics
- Standardized launches
- Faster optimization loops
Once those systems operated together, the agency stopped reacting slowly to performance changes and started identifying operational bottlenecks before revenue impact spread across accounts.
Common Questions About Facebook Ads Reporting Dashboard
What metrics should a Facebook ads reporting dashboard track daily?
Daily monitoring should include pacing, CTR trends, frequency changes, creative fatigue indicators, CPA volatility, attribution gaps, launch velocity, and landing page engagement.
How do agencies automate Facebook ads reporting without spreadsheets?
Agencies typically combine Meta data, structured metadata tagging, dashboard automation, standardized naming conventions, and centralized systems such as Instrumnt to reduce manual work.
Can AI tools help analyze Facebook ads dashboard performance data?
Yes. AI can accelerate anomaly detection, summarize performance changes, categorize creative trends, and prioritize optimization opportunities.
Does automation replace creative strategy?
No. Automation improves operational efficiency, while human teams remain responsible for strategy, positioning, messaging, budgeting, and decision-making.
For more context, see Revealbot.
For more context, see Meta for Business.
For more context, see Madgicx.