Why the Team Was Always Reacting to Performance Too Late
Monday at 8:42 a.m., the paid social team at Northline Growth opened their Facebook ads reporting dashboard and saw the same pattern they had been arguing about for months.
Spend was up.
CTR was down.
A creative that looked stable on Friday had faded over the weekend, and nobody caught it early enough to slow spend.
The problem was not missing data.
The team already had Meta Ads exports, pacing spreadsheets, Slack notes from design reviews, CSVs from creative QA, and campaign comments spread across multiple tabs.
The problem was delay.
By the time all the reporting landed in one place, the useful decision window had already passed.
That became expensive once spend increased.
According to Meta’s Q4 2024 earnings report, Meta’s family of apps reached 3.29 billion daily active people globally in Q4 2024, highlighting how quickly campaign feedback loops now move when advertisers scale aggressively. Source: Meta Q4 2024 Earnings Report.
Northline was spending enough on Facebook ads that even a two-day reporting lag meant weak creatives could burn through meaningful budget before anyone intervened.
Technically, they already had a dashboard.
But it behaved more like a recap document.
It explained what happened yesterday.
It did very little to help the team decide what needed attention now.
That distinction became harder to ignore after the team reviewed Mastering Facebook Ads Reporting: Tools That Reveal True Performance and compared their workflow with the faster reporting refresh cycles inside Meta for Business.
The dashboard itself was not broken.
The workflow around it was.
Scenario Breakdown: The Team That Could Not Identify Losing Creatives Fast Enough
Northline’s reporting process looked organized from the outside.
The media buyer exported account performance every morning.
Creative ops updated launch timestamps manually.
Finance tracked pacing in a separate spreadsheet.
A strategist merged everything into the Facebook ads reporting dashboard before the afternoon review.
Then the meeting started.
Then decisions happened.
The issue was timing.
The dashboard reflected campaign conditions from several hours earlier, sometimes longer if attribution lagged or naming cleanup took extra time.
That gap created obvious misses once the team started tracing decisions backward.
A campaign could overspend all morning while the team debated yesterday’s export.
A winning video might stay capped because attribution had not refreshed yet.
A weak variation could keep spending simply because nobody had connected launch timing with the drop in CTR.
The situation became worse once Northline increased creative testing volume after reading Scaling Facebook Ad Testing: Why AI Is the Key to Breaking Through Your Creative Bottleneck.
More tests gave the team more opportunities to find winners.
It also created more reporting noise.
Without faster visibility, the extra creative volume simply buried useful signals under exports and cleanup work.
The team eventually mapped out every step between launch and reporting review.
That exercise exposed a frustrating reality.
The Facebook ads reporting dashboard was functioning as the final destination for information instead of a live operational layer connected to campaign execution.
Mini Example: The Dashboard Metric That Exposed Creative Fatigue Early

The first useful change was surprisingly small.
Northline stopped opening reviews with blended campaign ROAS.
Instead, they pinned a simple block at the top of the Facebook ads reporting dashboard:
Creative age + frequency + CTR change since launch
That one view changed how the team interpreted performance.
One webinar creative for a B2B client looked stable at campaign level.
Spend was steady.
CPA still looked acceptable.
Nothing in the account summary suggested a major issue.
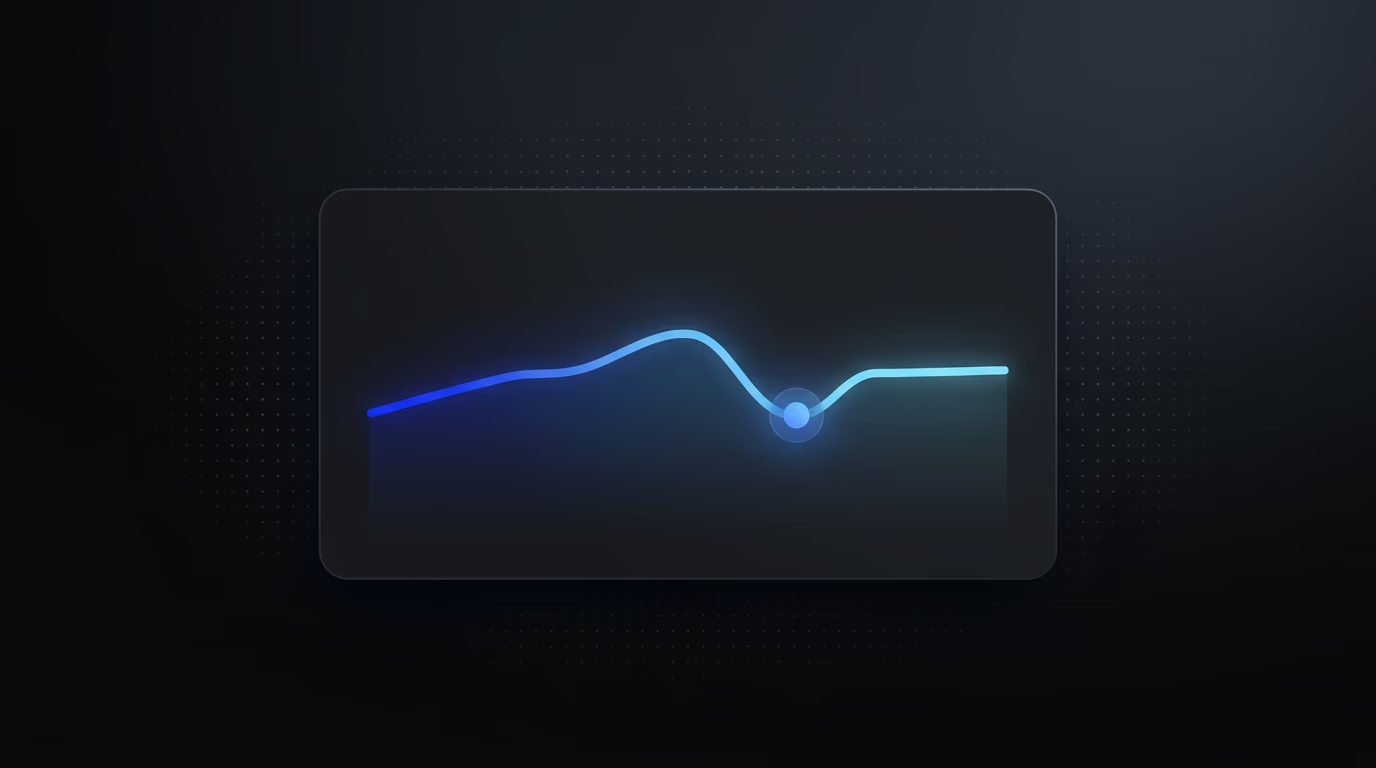
But inside the new dashboard view, the team noticed frequency climbing above 2.7 while CTR had fallen 18% over four days.
The creative was wearing out before the broader account metrics showed obvious damage.
That shifted the conversation immediately.
Nobody spent twenty minutes debating attribution windows.
The team rotated fresh assets that afternoon.
Performance stabilized the following week.
Northline started using Meta guidance around creative fatigue alongside internal thresholds tied to frequency and engagement decline.
The team also kept broader benchmark context nearby. According to WordStream’s 2024 Facebook advertising benchmarks, the average Facebook ads CTR across industries was approximately 0.90%, helping the team distinguish between account-specific fatigue and broader platform trends. Source: WordStream Facebook Advertising Benchmarks 2024.
But the benchmark itself was not the important part.
Speed was.
The dashboard exposed deterioration early enough for somebody to act before fatigue spread across the account.
Northline eventually expanded the dashboard into five decision-focused sections:
- Spend pacing versus weekly target
- CTR trend by creative since launch
- Frequency movement by audience segment
- CPA by launch cohort
- New creatives still below review threshold
Each block answered a specific operational question.
What needs budget adjustment?
Which creative is fading?
Which tests still need data?
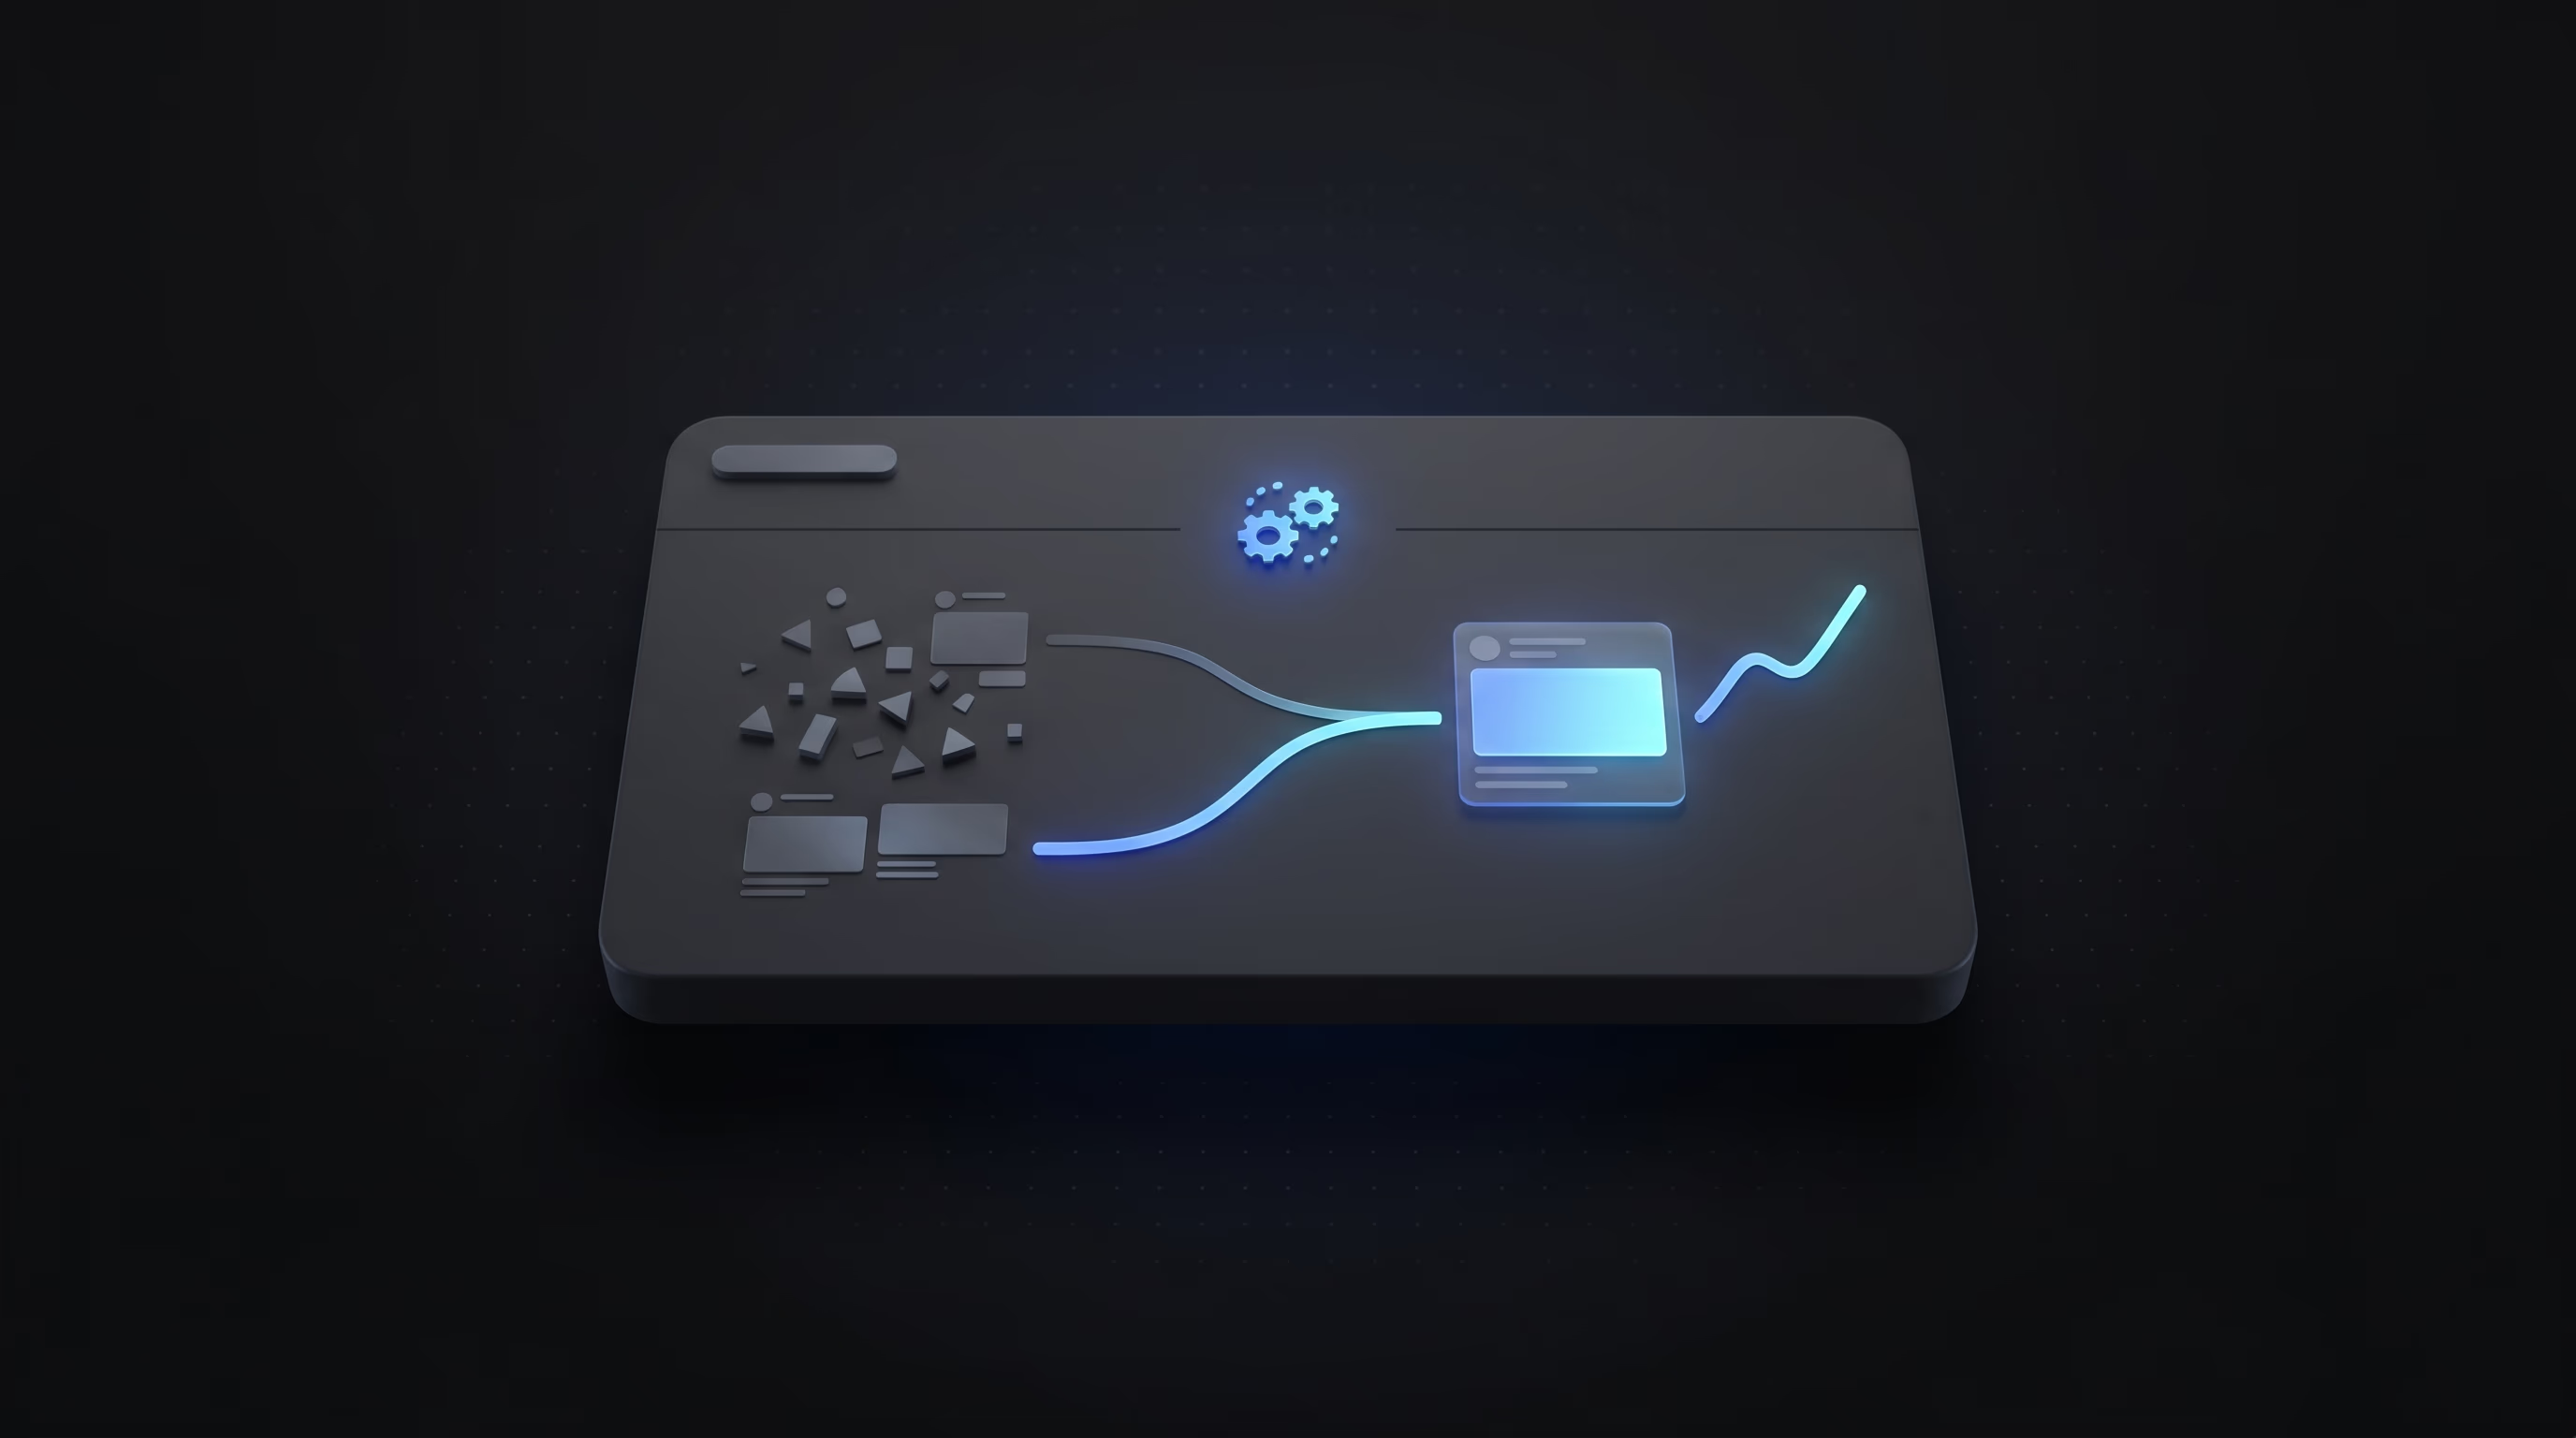
The dashboard stopped acting like a report card and started acting like a triage system.
That operational framing also aligned closely with lessons from Facebook Ads Uploader: Creative Fatigue Detection Before Meta Performance Slips.
How Reporting Delays Hurt Weekly Creative Testing Decisions
Once the team mapped the workflow honestly, the bottleneck became obvious.
Their reporting cycle consumed too much energy before anybody reached an actual decision.
Designers waited for confirmation before producing variants.
Media buyers delayed budget shifts until numbers were reconciled.
Analysts spent hours cleaning exports and fixing inconsistent naming.
By Wednesday afternoon, the team was effectively making three days of decisions at once.
Northline broke down one reporting cycle and tracked where time disappeared:
- 70 minutes exporting and cleaning Meta reports
- 40 minutes reconciling creative naming
- 25 minutes matching launch dates
- 45 minutes discussing partial findings that still needed verification
The issue was not a lack of reporting software.
The issue was operational structure.
That conclusion lined up with the workflow problems discussed in Why Meta Ads Reporting Breaks Once Creative Testing Scales.
The team realized the Facebook ads reporting dashboard could not sit at the end of the workflow anymore.
It had to become part of campaign operations itself.
Northline also reviewed how Sotrender, Revealbot, and Hunch approached reporting responsiveness and operational automation.
Different platforms handled workflows differently, but the common pattern was easy to spot.
Teams that shortened reporting lag made faster creative decisions.
The reporting layer stayed connected directly to campaign execution instead of sitting downstream from it.
That distinction mattered because creative testing volume was increasing every month.
Without operational reporting infrastructure, faster testing only created more chaos.
The Dashboard Metrics That Actually Changed Team Decisions
Northline eventually reorganized the Facebook ads reporting dashboard around operational decisions instead of vanity summaries.
Every section existed to trigger an action.
The pacing section answered whether spend needed adjustment before noon.
The fatigue section answered whether creative rotation needed acceleration.
The launch cohort section answered whether newly deployed ads had enough delivery to evaluate.
That shift sounds obvious in theory.
In practice, most dashboards still prioritize broad account summaries that flatten useful context.
Northline removed several metrics entirely from the opening view:
- Blended ROAS across unrelated campaigns
- Monthly cumulative spend snapshots
- Aggregated CTR averages
- Static screenshot exports
Instead, the dashboard emphasized movement over totals.
The team cared more about directional changes tied to launch timing than static averages.
A sudden CTR decline inside one launch cohort mattered more than a blended account average that still looked healthy.
That approach also reduced meeting fatigue.
Instead of debating what happened last week, the team focused on what needed action immediately.
Review sessions became shorter.
Budget reallocations happened faster.
Creative refreshes happened earlier.
The dashboard finally supported operational momentum instead of slowing it down.
Northline also borrowed ideas from 5 Tips for Media Buyers to Work Faster and Scale Smarter, especially around reducing approval bottlenecks and shortening the time between reporting visibility and creative action.
Uploader Workflow: Connecting Instrumnt Launch Data With Reporting Views

The real turning point came when Northline rebuilt campaign launches around structured metadata.
Every creative shipped through Instrumnt using a consistent upload format.
The Facebook ads uploader attached the same fields every time:
- campaign
- audience
- creative type
- concept angle
- launch timestamp
- owner
That consistency fixed several reporting problems at once.
The Facebook ads reporting dashboard could finally group performance automatically by launch cohort instead of relying on manual tagging.
A strategist could filter views instantly:
“Show all static image creatives launched Tuesday for finance lead gen.”
Or:
“Show video creatives launched in the last 72 hours with falling CTR.”
Before that change, those requests triggered spreadsheet cleanup and manual sorting.
Afterward, the data was already structured correctly when campaigns launched.
That also reduced naming confusion between creative ops and media buying.
The reporting system started reflecting what was actually happening in the account instead of what somebody had time to clean up later.
Northline connected the workflow using Instrumnt, Meta Marketing API documentation, and processes adapted from Meta Ads Bulk Upload Workflow: A Step-by-Step Operations Guide.
The operational impact showed up quickly.
Review meetings involved less backtracking.
Teams spent less time validating whether exports matched.
Strategists spent more time deciding what to pause, scale, refresh, or retest.
The Facebook ads uploader became more than a deployment tool.
It became the foundation for reporting reliability.
Using AI and Claude Code to Summarize Creative Trends Faster
Once the reporting structure stabilized, Northline added another layer.
AI handled the first pass of analysis every morning.
Claude Code reviewed exported Meta performance data, grouped creatives by format and message angle, and generated short summaries before the team opened the dashboard.
The notes were intentionally plain:
- “UGC testimonial creatives losing CTR fastest in enterprise audience.”
- “Static comparison ads outperforming video on CPL.”
- “Three newest creatives still below impression threshold.”
That removed repetitive analyst work that nobody particularly valued in the first place.
The team still reviewed the data manually.
But they no longer started cold every morning.
The summaries gave buyers and strategists a faster entry point into the account.
Northline also used AI to flag unusual pacing changes, summarize testing outcomes by launch cohort, and organize creative themes automatically inside reporting views.
That mattered because the account was producing too many assets for manual categorization to stay reliable.
According to Meta disclosures from 2024, more than 15 million ads were created using AI-powered tools across more than one million advertisers, highlighting how rapidly automation workflows are becoming embedded in Facebook ads operations. Source: Meta AI Advertising Announcements 2024.
Northline was using AI differently.
The goal was not more ad generation.
The goal was less reporting drag.
The workflow became simpler:
Review dashboard.
Read AI summaries.
Identify fatigue or pacing problems.
Launch the next testing cycle.
The process complemented Automated Facebook Ads Learning Loops with Instrumnt and Claude Code and Automate Creative Testing for Meta Ads.
What the Team Changed to Make Faster Budget and Creative Decisions
Six weeks after the rebuild, the changes were visible in day-to-day operations.
Monday reporting meetings finished early because fewer issues needed reconciliation.
Budget reallocations happened before noon instead of late afternoon.
Creative refreshes happened before fatigue spread across entire ad sets.
Launch velocity improved because deployment data and reporting data finally shared the same structure.
The biggest difference was psychological.
The team trusted the dashboard again.
Nobody treated it like an outdated snapshot that required another hour of cleanup before action.
Northline’s takeaway was straightforward.
A Facebook ads reporting dashboard should shorten the distance between signal and response.
That usually means:
- surfacing metrics tied directly to decisions
- connecting launch timestamps to reporting views
- reducing export cleanup work
- standardizing creative metadata
- using AI summaries to speed up first-pass analysis
Platforms like Sotrender, Revealbot, and Hunch reflect the broader movement toward faster reporting infrastructure and tighter operational loops.
But Northline’s biggest improvement did not come from adding more charts.
It came from rebuilding the workflow around decision speed.
Once they did that, the dashboard stopped feeling like a weekly reporting obligation.
It became a live operating system for creative testing, pacing, and budget control.
Teams struggling with fragmented Facebook ads reporting workflows often assume they need more dashboards.
In reality, they usually need better operational connections between uploads, metadata, launch timing, and reporting visibility.
That is the difference between passive reporting and active optimization.
Common Questions About Facebook Ads Reporting Dashboard
What metrics should a Facebook Ads reporting dashboard include for creative testing?
The most useful dashboard metrics connect directly to operational decisions. Teams commonly track CTR change since launch, frequency growth, CPA by launch cohort, spend pacing, and impression thresholds for newly deployed creatives. Metrics become more valuable when tied directly to launch timestamps and creative metadata.
How do Facebook Ads dashboards improve campaign decision speed?
A strong Facebook ads reporting dashboard reduces the time between performance changes and optimization decisions. Teams can identify creative fatigue, pacing issues, or budget inefficiencies earlier when reporting updates automatically instead of relying on delayed exports and spreadsheet cleanup.
Can AI automate Facebook Ads reporting analysis and creative insights?
AI can automate repetitive analysis tasks such as grouping creatives by angle, summarizing testing outcomes, flagging pacing anomalies, and identifying fatigue trends. Tools like Claude Code can help marketers review large export sets faster while keeping human teams focused on strategic decisions instead of repetitive reporting cleanup.
For more context, see Meta for Business.
For more context, see AdEspresso.
For more context, see WordStream's Facebook Ads benchmarks.