Most meta ads reporting tools are supposed to help teams make better decisions.
Many of them mostly help teams feel informed.
That difference sounds small until spend increases.
A dashboard with green ROAS numbers, clean trend lines, and polished summaries creates psychological relief. Teams feel like they understand what is happening.
Meanwhile campaigns underneath can already be decaying.
Creative fatigue rises.
Frequency increases.
AI shifts spend into combinations no one notices until CPA suddenly climbs.
That is the central problem with modern meta ads reporting tools.
They compress uncertainty into polished certainty.
The reporting problem is no longer visibility.
It is learning speed.
If a reporting system cannot accelerate feedback loops and shorten action cycles, it increasingly becomes presentation software.
For a deeper look at workflow failure patterns, read Why Meta Ads Reporting Breaks Once Creative Testing Scales.
Most Reporting Dashboards Optimize for Optics, Not Decisions
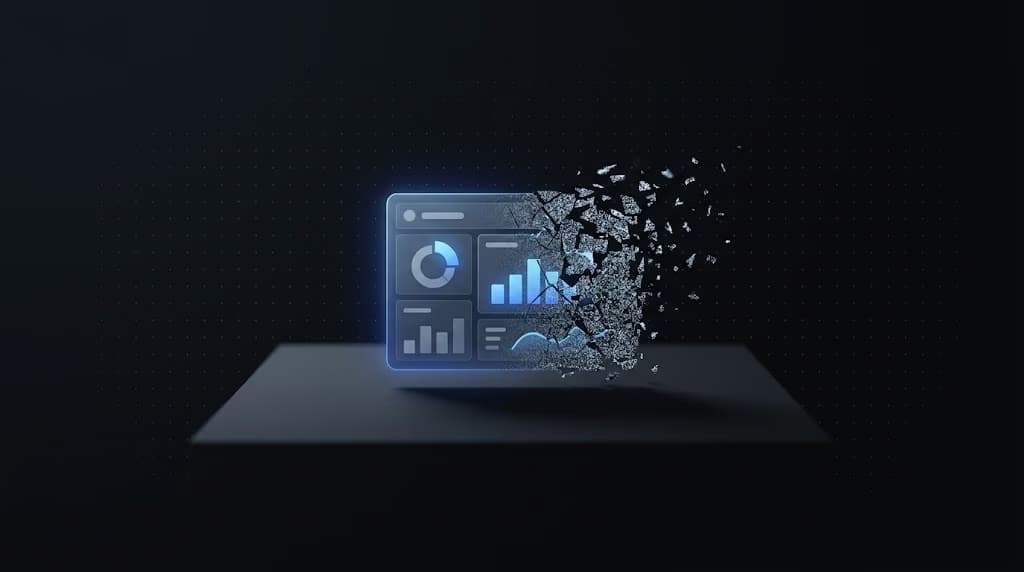
Most reporting systems optimize for things people can immediately recognize:
- Cleaner charts
- Faster exports
- Executive summaries
- Multi-channel rollups
- Presentation-ready dashboards
Useful? Sometimes.
Diagnostic? Much less often.
A dashboard showing 2.1x ROAS tells you almost nothing about why Facebook ads worked.
It does not tell you whether:
- One UGC creative absorbed most of the spend
- Frequency reached dangerous levels before CTR declined
- Meta discovered an unusually efficient audience segment
- One hook carried the account
- The campaign is scaling or quietly deteriorating
Many experienced operators still export raw data and investigate patterns manually.
The reason is simple.
Modern performance behavior often lives underneath summary metrics.
The smartest teams increasingly spend less time staring at dashboards and more time analyzing creative behavior.
For example, Meta reported in 2025 that more than 1 million advertisers used its generative AI advertising tools and collectively created over 15 million ads within a year. Source: Meta generative AI product updates, 2025.
That statistic matters because reporting environments built for slower manual workflows cannot easily interpret AI-driven creative volume.
The dashboard layer becomes detached from operational reality.
AI Broke the Old Reporting Logic

Older Facebook ads workflows assumed relatively stable variables.
You controlled targeting.
You segmented audiences.
You manually isolated placements.
You designed clean tests.
That environment barely exists now.
Meta also reported benchmark testing where Advantage+ shopping campaigns generated an average 22% higher return on ad spend than manual campaign setups across measured advertiser tests. Source: Meta Advantage+ benchmark reporting, 2025.
Those statistics reveal a structural shift.
AI is changing campaign behavior faster than most reporting systems can contextualize.
Spend allocation moves continuously.
Audience combinations change.
Creative distribution mutates.
Attribution becomes noisier.
A campaign can show weaker blended performance while Meta is discovering a stronger future creative pattern.
Another campaign can appear stable while a single asset quietly props up the account.
For a deeper breakdown of attribution complexity, read Diagnosing Attribution Challenges in Facebook Ads and How to Fix Them.
Attribution often measures outcomes.
Creative systems increasingly explain causes.
Dashboards frequently focus on the wrong side of that equation.
This is why many media buyers feel confused even when their dashboards appear healthy.
The metrics look stable.
The account underneath is unstable.
AI optimization layers can hide decay until delivery behavior shifts abruptly.
By the time blended CPA rises visibly, the real problem may have started days earlier.
The Real Bottleneck Is Creative Feedback Speed

The metric many teams never measure properly is feedback velocity.
How quickly can a team detect fatigue and replace losing creative?
That is often the real reporting challenge.
Not PDFs.
Not exports.
Not dashboard customization.
Research from Meta and Nielsen Catalina Solutions found that creative quality explained roughly 56% of variation in campaign sales lift across measured campaigns. Source: Meta and Nielsen Catalina Solutions creative effectiveness research.
Agency testing benchmarks frequently show that only around 5% to 10% of tested creatives become significant winners at scale. Source: Motion Creative Strategy benchmarks and agency testing datasets, 2025.
That means performance increasingly becomes a throughput problem.
You need:
- Faster testing loops
- Faster diagnosis
- Faster replacement cycles
- Faster launch workflows
When fatigue hits, blended account metrics often hide damage.
Strong operators monitor signals before account-wide deterioration becomes visible.
Signals may include:
- Hook-level CTR decline
- Frequency acceleration
- Spend concentration changes
- CPM volatility
- Audience saturation patterns
For a practical look at removing throughput bottlenecks, read Scaling Facebook Ad Testing: Why AI Is the Key to Breaking Through Your Creative Bottleneck.
The fastest learning systems usually outperform the cleanest reporting systems.
Another overlooked issue is reporting delay.
A team that discovers fatigue on Monday but launches replacements on Thursday already lost valuable optimization cycles.
That delay compounds as budgets increase.
In modern Facebook ads environments, speed often matters more than analytical perfection.
Sotrender vs Hootsuite Ads vs AdManage.ai vs Operational Workflows
Sotrender provides strong visibility and structured reporting.
Its dashboards help teams organize account data efficiently.
The limitation is that polished reporting can still stop at summaries.
Teams may see outcomes clearly without understanding why one creative collapsed while another absorbed budget unexpectedly.
Hootsuite Ads approaches the problem from a broader workflow perspective.
Cross-channel convenience matters.
But generalized reporting layers can flatten Meta-specific behavior.
Signals like:
- Advantage+ allocation shifts
- Creative fatigue velocity
- Broad targeting expansion
- Creative concentration patterns
can become harder to diagnose.
AdManage.ai moves further toward automation.
That direction reflects where the market is moving.
But automation without interpretation still leaves media buyers performing manual diagnosis.
The next generation workflow probably combines:
- Automation
- Interpretation
- Launch acceleration
That framing is where Instrumnt becomes interesting.
Instead of viewing reporting as static visualization, the workflow shifts toward operational throughput.
The distinction matters because most teams separate analytics and execution into disconnected systems.
One tool analyzes.
Another launches.
Another reports.
Another manages approvals.
Each handoff introduces delay.
For another perspective on broken tooling assumptions, read Why Most Facebook Ad Management Platforms Are Doing It Wrong (And What You Should Do Instead).
The strongest operational workflows reduce transition time between insight and deployment.
That matters more than adding another dashboard widget.
A Better Reporting Framework for Modern Meta Campaigns
The strongest reporting systems increasingly revolve around momentum rather than static ROAS snapshots.
Metrics that may better explain future performance include:
- Creative win rate
- Replacement cadence
- Time-to-launch velocity
- Audience decay speed
- Hook retention performance
- Spend concentration behavior
- Cost per incremental test
Those metrics help answer questions such as:
- Which concepts deserve more variations?
- Which hooks survive scaling?
- Which creatives collapse under frequency pressure?
- Which audiences respond differently to positioning?
Most dashboards stop one layer early.
They summarize outcomes without accelerating decisions.
That distinction increasingly separates modern reporting systems from historical reporting systems.
Operational reporting systems should also answer tactical questions quickly.
Examples include:
- Which creative concept deserves immediate iteration?
- Which audience is showing early fatigue?
- Which placement combination is deteriorating fastest?
- Which ad variation absorbed spend unexpectedly?
If the reporting layer cannot answer those questions rapidly, optimization slows.
That slowdown becomes expensive.
Especially inside AI-driven systems where delivery changes continuously.
Claude Code Changes the Reporting Workflow Completely
Claude Code introduces a different way to think about analysis.
Instead of waiting for dashboard summaries:
- Export Meta data
- Run structured prompts
- Detect spend concentration shifts
- Surface creative hypotheses
- Generate replacement recommendations
- Launch new assets
That workflow can shorten the delay between observation and action.
The value comes from diagnosis speed.
Claude Code also changes how teams document learnings.
Instead of manually reviewing spreadsheets during weekly calls, structured summaries can be generated rapidly.
The process becomes:
- Observe
- Diagnose
- Generate hypotheses
- Launch replacements
- Repeat
For examples of feedback systems built around operational learning loops, read Automated Facebook Ads Learning Loops with Instrumnt and Claude Code.
This is where AI becomes operationally useful.
Not because it replaces human strategy.
Because it accelerates interpretation.
That distinction matters.
The best teams are not removing humans from campaign analysis.
They are compressing the time between signal detection and strategic action.
The Facebook Ads Uploader Matters More Than Most Teams Think
Many teams underestimate workflow speed.
Insights lose value when implementation lags.
This is where a Facebook ads uploader can become more important than another reporting dashboard.
A Facebook ads uploader shortens the gap between learning and deployment.
When a creative fatigue signal appears, teams should be able to launch replacements quickly.
Execution speed matters because AI optimization systems continuously rebalance delivery.
If diagnosis takes three days and implementation takes another two, opportunities disappear.
For practical workflow ideas, read How to Scale Meta Ads with Bulk Uploading.
Teams that scale efficiently often build systems around:
- Bulk asset preparation
- Rapid naming workflows
- Creative categorization
- Faster approval routing
- Structured testing pipelines
Those operational layers are rarely visible inside dashboards.
But they heavily influence performance outcomes.
The Smartest Teams Are Quietly Moving Away From Dashboard Dependency
This transition is already happening.
Strong teams increasingly focus on operational signals instead of vanity metrics.
They care about:
- Creative win rate
- Time-to-launch velocity
- Replacement cadence
- Audience saturation speed
- Frequency acceleration
- Cost per incremental test
Meta increasingly automates execution.
Media buyers increasingly become creative systems managers.
That role depends on interpretation speed.
Not prettier dashboards.
If your meta ads reporting tools cannot help your team:
- Detect fatigue faster
- Launch creative faster
- Interpret AI behavior faster
- Diagnose Facebook ads faster
- Shorten testing cycles
then they may be creating reassurance more than improvement.
And reassurance becomes expensive as budgets scale.
For more context, see Instrumnt features.
For more context, see Instrumnt pricing.
Common Questions About Meta Ads Reporting Tools
What metrics actually matter in Meta ads reporting?
The most useful metrics increasingly relate to momentum and creative throughput rather than isolated ROAS snapshots.
Important operational metrics may include:
- Creative win rate
- Frequency acceleration
- Time-to-launch velocity
- Spend concentration behavior
- Audience decay speed
- Hook retention performance
Those metrics help teams identify why performance changes instead of merely reporting outcomes after deterioration already happened.
Why do Meta ads dashboards often fail to improve campaign performance?
Many dashboards optimize for visualization instead of action.
They summarize historical outcomes but fail to accelerate diagnosis, creative iteration, or replacement workflows.
As AI-driven Facebook ads systems become more dynamic, static reporting layers often become disconnected from operational decision-making.
Can AI tools replace manual Facebook ads reporting analysis?
Not completely.
AI tools like Claude Code can dramatically accelerate pattern detection, structured analysis, and hypothesis generation.
But creative strategy, offer positioning, audience interpretation, and business context still require human judgment.
The strongest workflows combine AI-assisted analysis with experienced operator decision-making.
How many ad variations should teams test?
Most high-performing Facebook ads teams test far more creatives than they used to.
A practical starting point is 3 to 5 variations per ad set, then expanding testing volume as workflow capacity improves.
Because only a small percentage of creatives typically become major winners, testing throughput increasingly determines account scalability.
What role does a Facebook ads uploader play in reporting?
A Facebook ads uploader reduces the delay between insight and deployment.
That matters because reporting without execution speed creates operational lag.
The faster a team can launch replacement creatives after diagnosing fatigue, the more effectively it can maintain account performance inside AI-optimized Meta environments.
For more context, see Ads Uploader.
For more context, see Meta Blueprint.
For more context, see Revealbot.