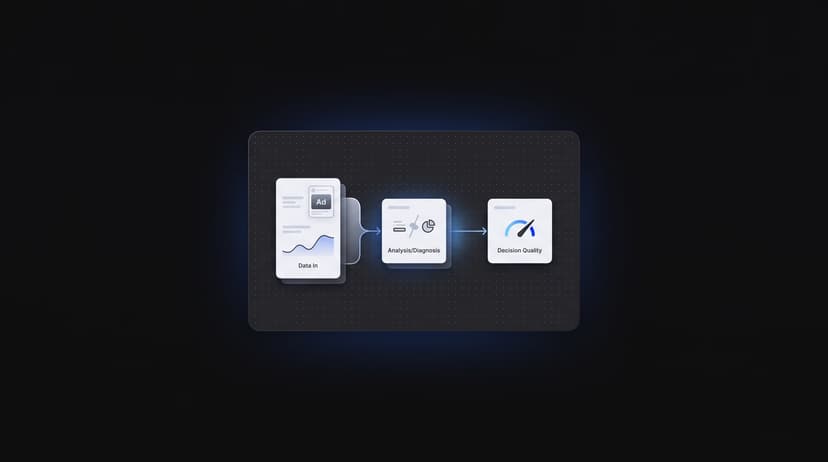
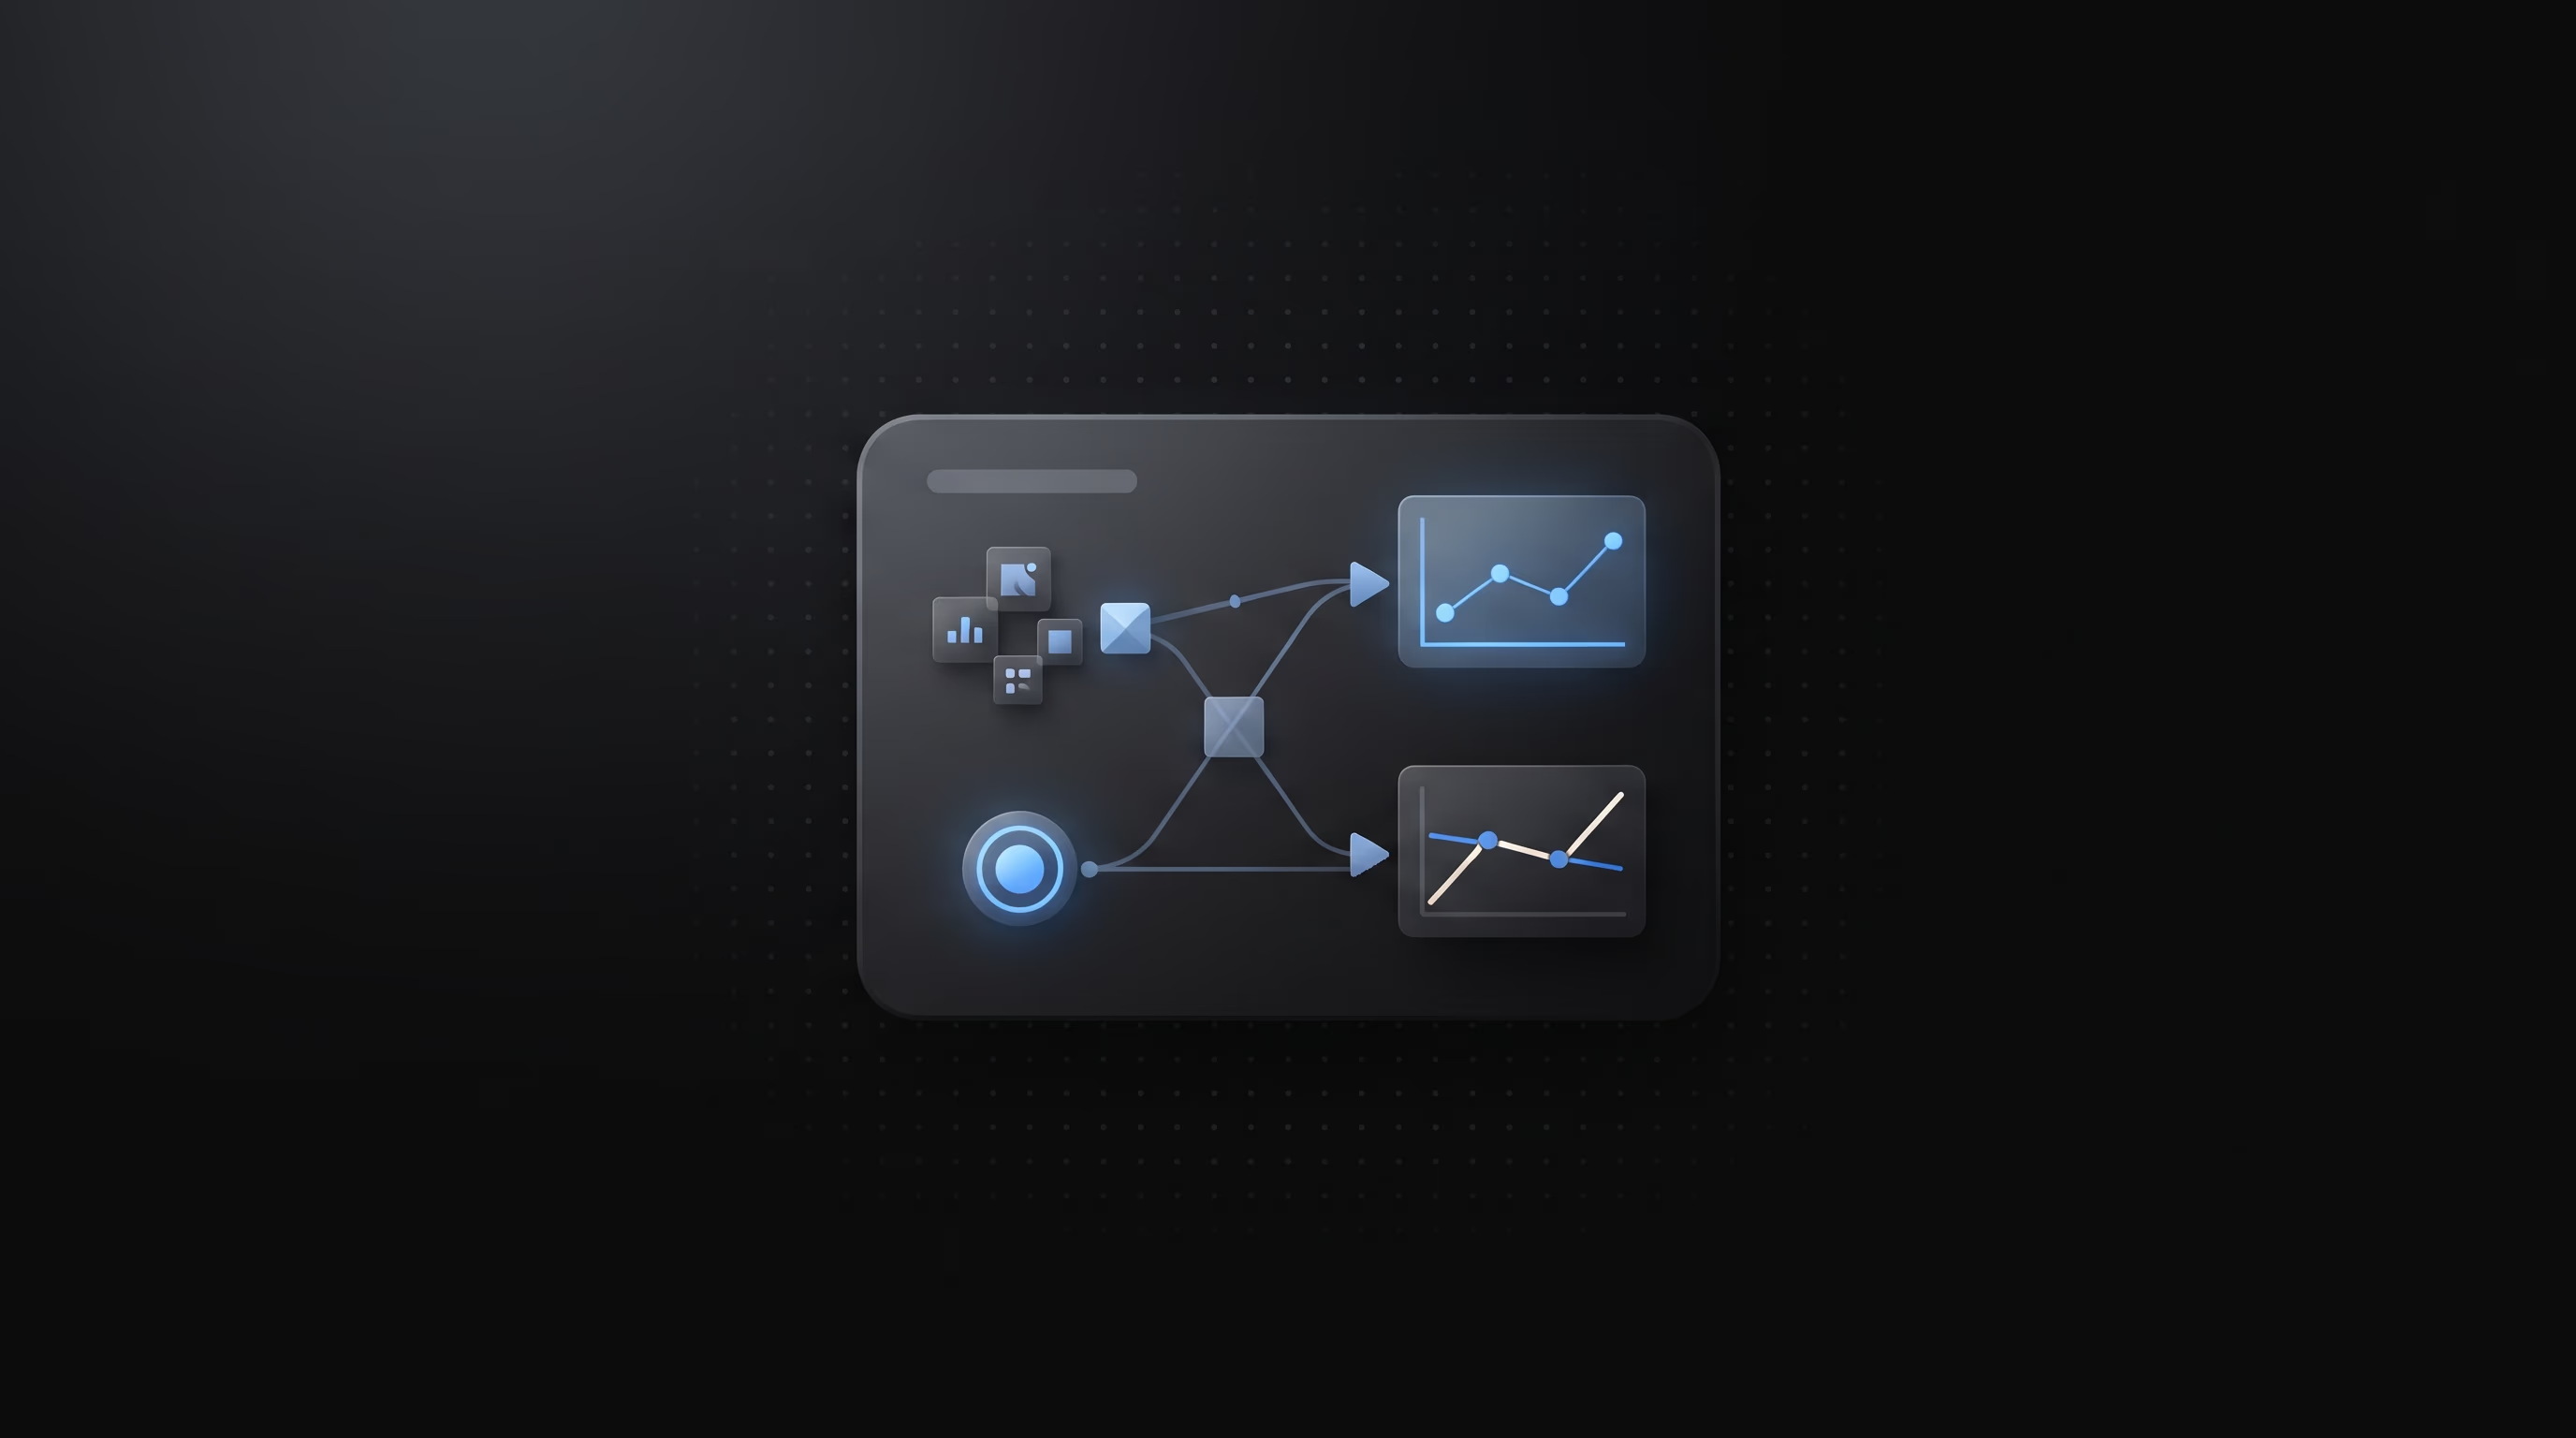
The reporting dashboard looked successful — until revenue dropped

Many marketers searching for facebook ads reporting dashboard examples expect screenshots, templates, or attractive charts. Those resources are useful, but the most valuable dashboard is the one that helps explain why business performance changed.
Imagine a Monday morning review. Your Facebook Ads dashboard shows a higher click-through rate, lower cost per click, stable ROAS, and consistent delivery. Finance, however, reports that revenue from paid acquisition declined by 15% during the same period.
At that point the dashboard stops being a reporting tool and becomes the starting point of an investigation.
Experienced media buyers rarely respond by creating another visualization. Instead they ask operational questions. Did new creatives launch? Was a high-performing advertisement replaced? Did the Facebook ads uploader publish a large deployment? Did attribution settings change? Was the landing page updated at the same time?
The strongest reporting workflow combines performance metrics with campaign history, creative production, deployment events, and business outcomes so every trend has operational context.
Mini example: when Facebook Ads metrics disagree
Suppose your dashboard reports:
- CTR increases by 18%.
- CPC decreases by 9%.
- ROAS remains stable.
- Revenue declines by 15%.
- Average order value falls.
Looking only at the dashboard suggests everything is healthy. Looking deeper tells a different story.
Perhaps a new creative attracted more curiosity clicks but lower purchase intent. Perhaps inventory shortages reduced completed purchases. Perhaps campaign duplication introduced audience overlap. Perhaps creative fatigue reduced repeat customer performance.
Statistics become far more meaningful when interpreted together.
According to Meta, implementing the Meta Pixel together with the Conversions API can improve event matching quality compared with browser-only measurement, helping advertisers recover more complete conversion signals for optimization and reporting.
According to WordStream's Facebook Ads Benchmarks, average Facebook Ads click-through rates differ significantly by industry, ranging from under 1% in some verticals to well above 2% in others. That means a high CTR by itself is not reliable evidence of commercial success.
Databox has also reported that ROAS, conversion rate, revenue, and conversion volume consistently rank among the most closely monitored advertising KPIs, reinforcing that experienced teams evaluate multiple metrics together rather than relying on a single number.
These industry statistics demonstrate why isolated metrics rarely explain business outcomes.
What dashboard data missed: workflow events matter
Most dashboards explain what happened.
Far fewer explain why it happened.
Operational context typically includes:
- Creative approval dates.
- Landing page releases.
- Audience adjustments.
- Budget reallocations.
- Campaign duplication.
- Naming convention updates.
- Facebook ads uploader deployment logs.
Imagine a Facebook ads uploader launches 250 advertisements within one hour. Operationally that is efficient. However, if dozens of proven creatives are replaced simultaneously, multiple variables change together and diagnosis becomes much harder.
Connecting reporting with deployment history answers practical questions:
- Which creative launched immediately before revenue declined?
- Which uploader batch introduced the affected campaigns?
- Were attribution windows modified?
- Did audience structure change?
- Did campaign naming make investigation easier or harder?
Instead of functioning only as a scoreboard, reporting becomes a repeatable diagnostic workflow.
Teams interested in scalable experimentation can also explore Automate Creative Testing for Meta Ads and Facebook Ad Reporting Accuracy: A Practical Workflow for Diagnosing Data Conflicts and Improving Decision Quality.
Competitor comparison: dashboards versus operational context
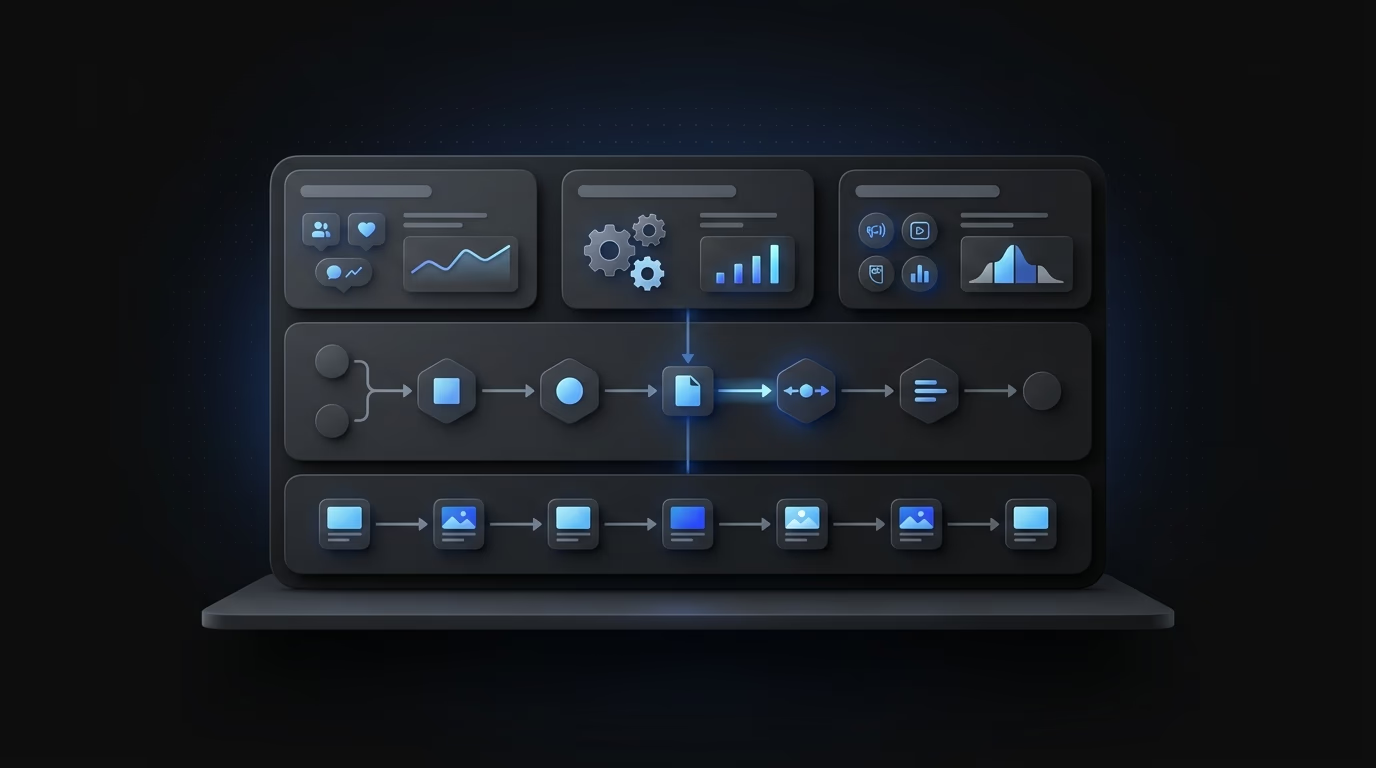
Platforms such as Sotrender, AdManage.ai, and Hootsuite Ads provide valuable reporting capabilities. They simplify visualization, scheduled reporting, and campaign monitoring.
Typical dashboard questions include:
- Which campaign produced the highest ROAS?
- Which audience generated the most spend?
- Which creative earned the highest CTR?
These are valuable reporting questions.
Operational teams often require another layer of visibility.
Questions dashboards frequently cannot answer include:
- Which designer produced the winning creative?
- Which Facebook ads uploader deployment introduced the campaign?
- Which approval delay slowed testing?
- Which operational bottleneck reduced launch velocity?
Rather than replacing reporting platforms, many organizations combine dashboard software with workflow documentation and deployment history.
This additional visibility is where Instrumnt differentiates itself by connecting creative production, approvals, upload workflows, reporting context, and operational history into one continuous process.
Using AI and Claude Code to investigate reporting problems
AI becomes substantially more useful when it receives structured operational data instead of isolated screenshots.
Experienced teams provide:
- Campaign metrics.
- Revenue trends.
- Creative launch history.
- Landing page changes.
- Audience edits.
- Facebook ads uploader logs.
- Attribution changes.
Claude Code can summarize investigations, identify unusual metric relationships, compare reporting periods, and generate standardized investigation reports.
For example, AI may detect that revenue began declining immediately after a deployment containing twenty new creatives even though CTR increased. That insight provides analysts with a practical starting point instead of an unsupported optimization recommendation.
Instrumnt strengthens this workflow by combining deployment history, creative operations, reporting context, and collaboration into a unified operational system.
Building a repeatable reporting investigation workflow
Rather than building another dashboard template, build a repeatable investigation process.
Step 1: Validate business outcomes
Confirm purchases, revenue, qualified leads, and downstream business metrics before reacting to advertising KPIs.
Step 2: Compare related metrics
Never evaluate CTR without conversion rate.
Never evaluate ROAS without revenue.
Never evaluate CPC without purchase quality.
Always compare multiple related metrics together.
Step 3: Review workflow history
Inspect uploader batches, creative launches, approvals, and campaign edits.
Step 4: Verify measurement consistency
Confirm Pixel events, Conversions API implementation, and attribution settings remain consistent across reporting periods.
Step 5: Evaluate creative quality
Determine whether the newest creative improved qualified purchases or merely attracted inexpensive clicks.
Step 6: Document the investigation
Record the explanation behind every major performance change so future analysts can understand historical decisions without repeating the same investigation.
Teams building mature reporting systems may also benefit from reading Scaling Facebook Ad Testing: Why AI Is the Key to Breaking Through Your Creative Bottleneck.
Common questions about facebook ads reporting dashboard examples
Why can a Facebook Ads dashboard look healthy while revenue decreases?
Because engagement metrics and commercial outcomes measure different things. CTR, impressions, and CPC may improve while purchase intent, conversion quality, or average order value declines.
What metrics should be checked together when Facebook Ads reporting data conflicts?
Review CTR, CPC, CPM, conversion rate, purchases, ROAS, revenue, average order value, attribution settings, creative launches, and workflow history together.
How can AI and Claude Code help analyze Facebook Ads reporting problems?
AI can summarize campaign history, identify unusual metric relationships, compare reporting periods, and organize structured investigations. Claude Code is particularly effective when analyzing campaign exports together with operational workflow logs and Facebook ads uploader activity.
Final takeaway
The best facebook ads reporting dashboard examples do far more than display attractive charts. They explain why business performance changes.
A modern reporting process combines dashboard metrics with creative testing history, deployment timelines, Facebook ads uploader activity, operational events, AI-assisted investigation, and documentation. Instrumnt supports this connected workflow by linking campaign execution with reporting context.
When the dashboard appears healthy but revenue declines, resist the temptation to build another visualization. Build a better investigation system that combines reliable reporting with operational evidence and measurable business outcomes.
For more context, see Meta Partner Directory.
For more context, see Meta for Business Help Center.
For more context, see Triple Whale's Facebook Ads benchmarks.