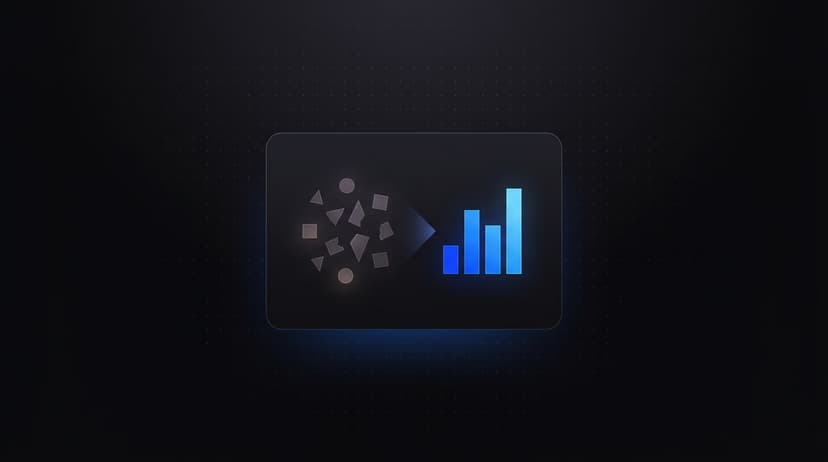

Diagnosis: why discrepancies are not a reporting problem

Facebook ads reporting discrepancies rarely begin inside a dashboard. They usually originate much earlier, when attribution rules, event collection, campaign deployment, identity resolution, and downstream reporting systems interpret the same customer journey differently.
Performance marketers frequently compare Meta Ads Manager, Google Analytics, CRM platforms, warehouse dashboards, and executive reports only to discover conflicting totals. Instead of asking which platform is correct, begin by identifying which measurement layer introduced the difference.
Treat reporting discrepancies as an optimization risk rather than a reporting inconvenience. Once budgets, creatives, audiences, or campaign structures are adjusted using unreliable data, every optimization decision becomes less trustworthy.
For additional background on measurement quality, see Facebook Ad Reporting Accuracy: A Practical Workflow for Diagnosing Data Conflicts and Improving Decision Quality.
Where reporting discrepancies actually come from
Most reporting conflicts fall into several predictable categories:
- Different attribution windows.
- Duplicate or missing conversion events.
- Processing delays between systems.
- Event naming inconsistencies.
- Dashboard transformation logic.
- Manual campaign creation errors.
- Identity resolution differences.
- Inconsistent Facebook ads uploader workflows.
Looking at discrepancies through these categories is far more effective than attempting random fixes. Teams that classify problems before troubleshooting generally resolve issues faster because every investigation begins with evidence instead of assumptions.
Attribution, tracking, and workflow failures
Attribution receives most of the attention, but it represents only one layer of the reporting stack.
Tracking quality determines whether events arrive correctly. Workflow discipline determines whether campaigns are deployed consistently. Dashboard transformations determine how raw events become business metrics. Infrastructure changes in one layer frequently create unexpected differences elsewhere.
| Symptom | Likely Cause | Investigation |
|---|---|---|
| CRM shows fewer purchases | Attribution mismatch | Compare attribution windows |
| Analytics reports fewer sessions | Tracking differences | Validate UTMs and landing pages |
| Dashboard ROAS changes overnight | Transformation logic | Compare raw exports with dashboard calculations |
| Campaign names become inconsistent | Manual deployment | Review uploader history and naming standards |
If multiple systems disagree, avoid changing campaigns until the investigation identifies the root cause.
A repeatable investigation checklist before changing campaigns
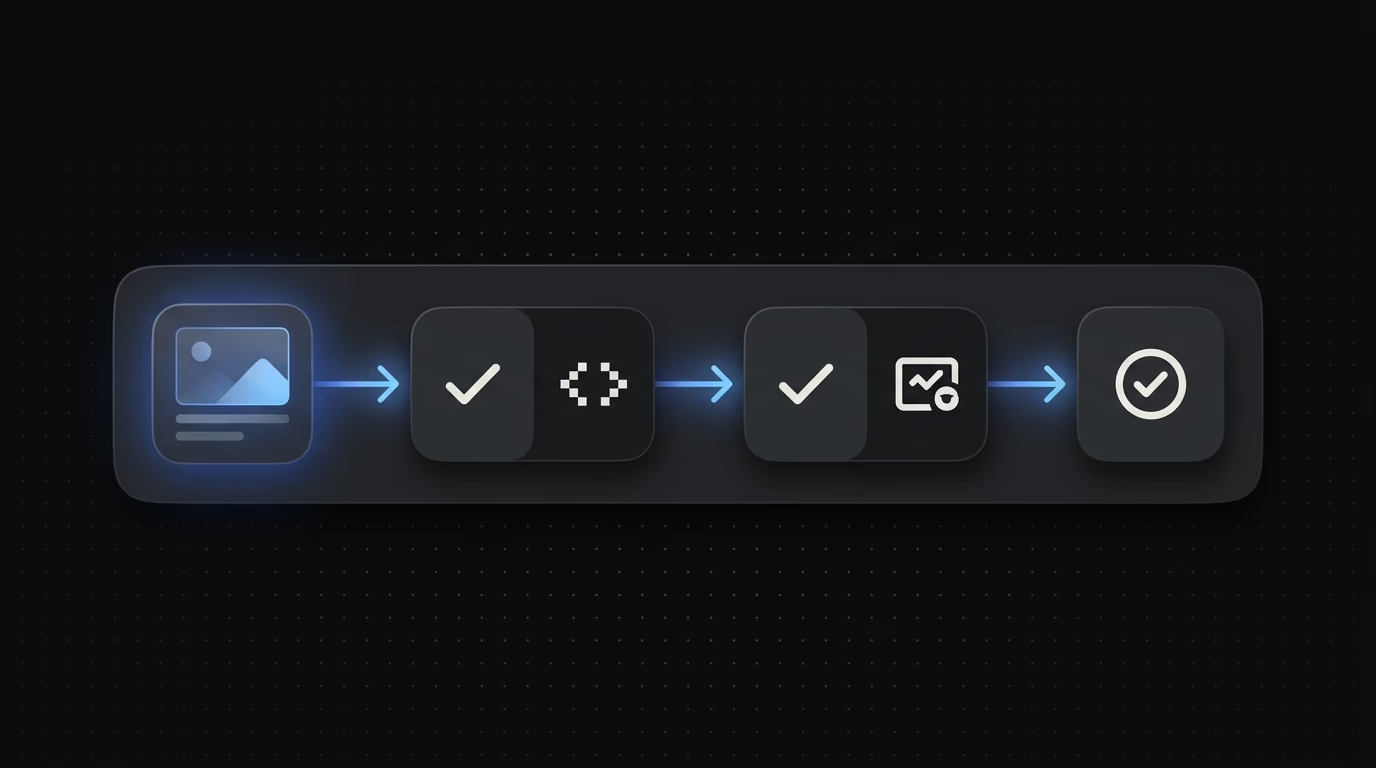
Before pausing campaigns or reallocating budget, follow a consistent investigation process.
- Export raw reports from every platform.
- Confirm attribution windows match.
- Compare event names across systems.
- Verify Pixel and server-side events are not duplicated.
- Check campaign naming consistency.
- Review deployment logs from the Facebook ads uploader.
- Compare raw data against dashboard calculations.
- Document every confirmed discrepancy before making optimization decisions.
Using the same sequence each time creates an evidence-first operating procedure that scales across teams while reducing unnecessary optimization mistakes.
Operational validation framework for marketing teams
Many reporting investigations fail because organizations jump directly into optimization instead of validation.
Begin every reporting review by comparing platform totals before discussing campaign performance. If discrepancies exceed your documented tolerance, postpone optimization conversations until measurement quality has been verified.
Maintain documentation covering event definitions, attribution windows, dashboard formulas, naming standards, and deployment workflows. Version-controlled documentation makes it easier to identify exactly when a reporting difference first appeared.
Assign ownership for instrumentation, deployment, reporting transformations, and business intelligence separately. Clear accountability dramatically reduces recurring measurement confusion.
Why uploader workflows affect reporting quality
Deployment consistency is often overlooked.
A Facebook ads uploader does more than accelerate launches. It standardizes campaign naming, tracking parameters, creative organization, metadata consistency, and deployment structure.
Manual campaign creation introduces small inconsistencies that accumulate over time. Those inconsistencies eventually surface as reporting conflicts that are difficult to diagnose because every downstream system inherits inconsistent inputs.
Platforms such as Instrumnt emphasize structured deployment workflows that reduce operational variance before reporting systems consume campaign data.
Related reading: Why Most Facebook Ads Are Created Wrong (And How AI Fixes It).
Comparing reporting workflows across common platforms
Different reporting platforms solve different operational problems.
Sotrender primarily emphasizes visualization and reporting dashboards. Revealbot focuses on automation and campaign management workflows. Hootsuite Ads integrates reporting into a broader social media management ecosystem.
Each platform can improve visibility, but none can eliminate discrepancies caused by inconsistent attribution models, incomplete event collection, deployment mistakes, or dashboard transformation logic. Reliable reporting still depends on validating measurement quality before trusting dashboards or automation.
Using Claude Code and AI to validate datasets
Claude Code provides an additional validation layer that complements existing reporting tools.
Instead of replacing attribution systems, AI can compare exported datasets, detect duplicate conversions, identify missing events, highlight inconsistent campaign naming, compare schemas across platforms, and automatically generate investigation summaries.
Typical validation tasks include:
- Comparing event-level exports.
- Finding duplicate purchases.
- Detecting naming convention drift.
- Highlighting time-series anomalies.
- Producing investigation documentation.
- Comparing warehouse exports against dashboard calculations.
Using Claude Code alongside AI-assisted validation encourages repeatable investigations instead of reactive debugging.
Industry benchmarks and reporting context
Benchmarks provide context, but they should never be treated as proof that your own reporting is correct or incorrect.
According to WordStream's Facebook Advertising Benchmarks, the average Facebook ads click-through rate across industries is approximately 0.90%. The same research reports an average Facebook ads conversion rate of approximately 9.21%. Because these figures aggregate many industries and campaign objectives, they are useful as directional context rather than optimization targets.
Meta also explains that attribution settings, modeled conversions, reporting windows, and identity matching can legitimately produce different values across reporting environments. Triple Whale likewise notes that blended measurement often differs from platform-specific reporting because each system measures a different stage of the customer journey.
Statistics every reporting team should understand
- 0.90% average click-through rate (CTR) across industries according to WordStream's Facebook Advertising Benchmarks. Source: WordStream Facebook Advertising Benchmarks.
- 9.21% average conversion rate across industries according to the same WordStream benchmark study. Source: WordStream Facebook Advertising Benchmarks.
These statistics should be interpreted as reference values with clear source attribution, not universal expectations for every account.
Building a durable reporting governance system
Long-term reporting quality depends on governance rather than one-time fixes.
An effective governance framework includes:
- Standardized naming conventions.
- Consistent event definitions.
- Deployment through a structured Facebook ads uploader.
- Regular validation audits.
- Documented attribution assumptions.
- Cross-platform reconciliation procedures.
- Automated AI-assisted quality checks using Claude Code.
- Structured deployment workflows supported by Instrumnt.
Organizations that establish repeatable governance spend less time explaining conflicting reports and more time improving campaign performance.
Frequently asked questions
Why do Facebook Ads Manager and Google Analytics report different conversion numbers?
They measure user journeys differently. Attribution models, identity resolution, reporting windows, modeled conversions, session definitions, and processing timing all contribute to expected differences.
How large of a Facebook Ads reporting discrepancy should trigger a technical investigation before optimization?
Rather than relying on a universal threshold, establish an internal tolerance based on historical reporting behavior. Many organizations investigate persistent differences around 15% to 20% after ruling out reporting delays, but consistency is more important than the exact percentage.
How can Claude Code help diagnose Facebook Ads reporting discrepancies without replacing attribution tools?
Claude Code can compare exported reports, identify mismatched event schemas, detect anomalies, validate naming conventions, summarize investigation findings, and generate repeatable documentation while leaving attribution calculations to the reporting platforms themselves.
Final thoughts
Facebook ads reporting discrepancies should not automatically be treated as dashboard failures. They are usually symptoms of deeper operational differences involving attribution, event collection, transformation logic, deployment workflows, and governance.
Teams that combine disciplined deployment through a Facebook ads uploader, structured governance, Instrumnt workflows, AI-assisted validation with Claude Code, and repeatable investigation procedures are better equipped to optimize campaigns using trustworthy evidence rather than conflicting metrics. Consistent measurement discipline ultimately creates better optimization decisions than relying on any single reporting dashboard.
For more context, see WordStream's Facebook Advertising Benchmarks, Triple Whale's Facebook Ads Benchmarks, and Meta's Partner Directory.
Common questions about facebook ads reporting discrepancies
What is the best way to approach facebook ads reporting discrepancies?
The best approach depends on your team size and launch volume. Start by structuring your workflow around batch preparation and bulk uploading, then layer in automation for the parts that do not require human judgment.
How many ad variations should I test?
Testing strategy depends on budget and traffic volume, but maintaining several creative variations allows marketers to distinguish reporting issues from creative performance changes more effectively.
Does automation replace the need for creative strategy?
No. Automation improves operational consistency, while creative strategy, audience selection, offer development, and measurement governance still require human expertise.
For more context, see WordStream's Facebook Ads benchmarks.
For more context, see Triple Whale's Facebook Ads benchmarks.
For more context, see Meta Partner Directory.